How to Choose Utility Solar in 2026?
Choosing utility solar in 2026 requires more than comparing panel prices. A project may look inexpensive on paper, yet fail when interconnection studies, curtailment, or transformer delays appear. The International Energy Agency’s Renewables 2024 report expects global renewable capacity to expand sharply through 2030, with solar PV providing the largest share of new additions. That growth creates opportunity, but also tougher competition for grid capacity and suitable land.
Lazard’s Levelized Cost of Energy+ 2024 analysis shows utility-scale solar remains among the lowest-cost new generation options in many markets. However, LCOE does not measure every project risk. Storage duration, transmission access, module warranties, local weather, and revenue structure can change the final decision. As IEA Executive Director Fatih Birol stated, “Solar PV is now the cheapest source of electricity in history.” The phrase is powerful, but incomplete.
Cost alone is not enough.
Berkeley Lab’s Utility-Scale Solar report highlights continuing growth in project size, while also tracking longer development timelines and rising interconnection challenges. A practical buyer should examine a project like a physical asset: dusty panels after a dry summer, flooded access roads, clipped output at noon, and a battery waiting for a delayed inverter. Developers should also test degradation assumptions and merchant-price exposure. No forecast is perfect. That is the uncomfortable part. The strongest utility solar choice balances bankability, grid readiness, operational evidence, and long-term flexibility.
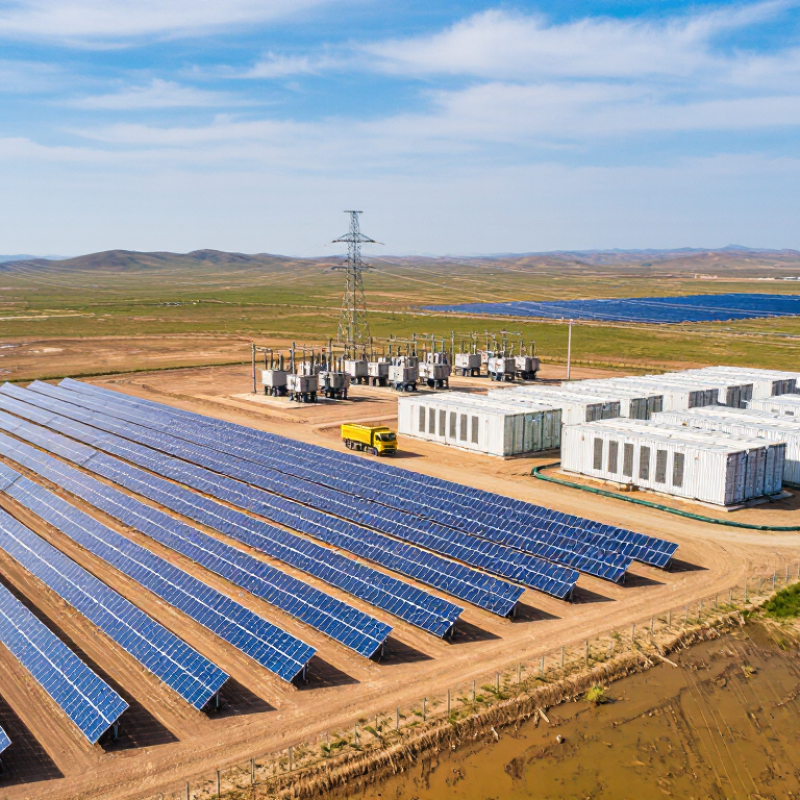
Define Utility-Scale Solar and Its Role in the 2026 Energy System
How to Choose Utility Solar in 2026?
Utility-scale solar refers to large, grid-connected photovoltaic projects, often producing more than one megawatt. These facilities usually serve wholesale electricity markets, cities, or industrial loads. In 2026, their role extends beyond daytime generation. Solar fields increasingly work with batteries, flexible demand, and stronger transmission networks. A well-designed project can lower fuel use, reduce price exposure, and support grid reliability during clear afternoon hours.
Choosing utility solar requires more than comparing installed capacity. Examine the solar resource with long-term weather data, not one favorable year. Review land slope, drainage, access roads, and nearby transmission capacity. Interconnection delays can quietly damage an otherwise attractive project. Financial analysis should include panel degradation, inverter replacement, insurance, taxes, battery cycling, and expected curtailment. The lowest advertised cost is rarely the lowest lifetime cost.
Field assessments also need practical evidence. Inspect soil conditions, dust levels, vegetation growth, and seasonal shading. Ask how performance data will be measured and independently verified. Safety procedures, worker training, and equipment traceability matter throughout construction and operation. I have seen models look precise while relying on weak assumptions. That is uncomfortable, but useful. Forecasts should show uncertainty ranges, not only a single annual output figure. In 2026, the strongest solar choices will balance energy yield, grid value, resilience, and honest limits.
Compare Photovoltaic Technologies, Trackers, Storage, and Inverters
Choosing utility-scale solar in 2026 starts with site evidence, not a preferred equipment list. Photovoltaic technology must match heat, dust, humidity, land limits, and degradation expectations. High-efficiency crystalline modules suit constrained sites, while bifacial designs can gain energy over reflective ground. Thin-film options may perform steadily in heat and diffuse light, but they require more area. Measure soiling, wind, snow, and seasonal irradiance before comparing annual yield. A spreadsheet alone can hide weak assumptions. Reality is messier.
Trackers often increase production, especially where morning and afternoon irradiance matters. They also add motors, foundations, maintenance routes, and wind-stow risks. Fixed-tilt arrays can be less productive but simpler to operate. Model both layouts with local weather data and realistic availability. Do not trust a single optimistic simulation. Test it against nearby operating projects when possible. Storage changes the project’s purpose. Batteries can shift midday energy into evening demand, reduce curtailment, and support grid services. Yet round-trip losses, thermal control, augmentation, fire protection, and replacement timing affect the real business case. A battery sized only for peak headlines may sit underused.
Inverters deserve equal scrutiny. Central units can simplify large blocks, while distributed units may limit losses from localized shading or failures. Compare efficiency curves, reactive-power capability, grid-forming readiness, spare-part access, and service response. Ask how the system behaves during weak-grid events. Field experience shows that availability depends on controls and maintenance, not nameplate efficiency alone. Designs can fail. Keep a contingency margin. Prices, interconnection rules, and storage revenues can change before construction ends.
How to Choose Utility Solar in 2026?
Comparison of representative utility-scale photovoltaic technologies, tracker gains, inverter efficiency, and battery storage performance.
Values are representative 2026 industry midpoints based on typical utility-scale engineering ranges. TOPCon and HJT generally provide higher module efficiency, single-axis tracking can increase annual energy yield by approximately 15–25% versus fixed-tilt systems, modern inverters commonly reach about 98–99% peak efficiency, and lithium-iron-phosphate battery systems typically deliver approximately 85–90% round-trip efficiency. Actual results depend on climate, design, site layout, operating temperature, and project controls.
Select Developers, Plan Construction, and Measure Operational Performance
How to Choose Utility Solar in 2026?
Select Developers, Plan Construction, and Measure Operational Performance
Choosing a utility-scale solar developer requires more than comparing tariff prices. Review its completed projects, safety record, engineering controls, and financial discipline. IEA’s Renewables 2024 report recorded almost 420 GW of new solar capacity in 2023. That rapid expansion increases competition, but it can also hide rushed assumptions. Ask for measured availability, change-order history, and independently verified production data. Experience matters.
Construction planning should connect design with local reality. Confirm grid studies, land conditions, flood risks, and seasonal access before signing major contracts. Model module delivery, transformer lead times, and extreme-weather delays. IRENA’s Renewable Power Generation Costs in 2023 report placed global utility-scale solar costs near USD 0.044 per kWh. However, that figure is not a project guarantee. Weak interconnection planning can erase an attractive cost advantage. A perfect schedule is usually fiction.
Operational performance needs a clear measurement framework from day one. Track availability, performance ratio, soiling loss, inverter clipping, curtailment, and annual degradation. NREL research commonly identifies photovoltaic degradation near 0.5% to 0.8% per year, depending on technology and climate. Compare actual energy against a weather-adjusted baseline. Berkeley Lab’s utility-scale solar reports also show that project costs and operating conditions vary substantially by region. Do not reward a developer for a high first-year forecast alone. The data may look impressive. It may still be wrong.