Why Choose Solar Installation for Your Business?
Why Choose Solar Installation for Your Business?
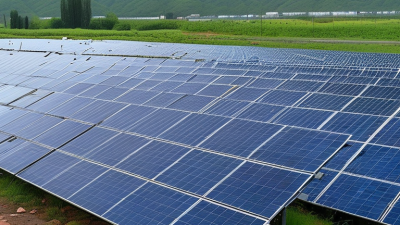
Running a business means watching every expense, including the electricity bill that arrives each month. Solar installation can turn an unused rooftop, parking area, or nearby ground space into a productive business asset. Panels capture sunlight during operating hours, when many companies use lighting, cooling, computers, and machinery.
Energy expert Amory Lovins said, “The best way to predict the future is to design it.” His statement reflects a practical business choice. A well-designed solar system can reduce exposure to changing utility prices, support energy planning, and strengthen a company’s environmental credibility. It may also complement battery storage, efficient equipment, and electric vehicle charging.
The details matter.
A professional installer should inspect the roof condition, shading, electrical capacity, local climate, and future expansion plans. Production estimates must use realistic sunlight data, not optimistic promises. Maintenance records, warranties, monitoring tools, and insurance requirements deserve careful review. These steps help businesses understand performance before signing a contract.
Solar is not a magic switch. Initial costs can be significant, and unsuitable roofs may require repairs first. Some facilities may generate less energy during cloudy seasons. I once saw how a shaded rooftop reduced expectations, even though the system remained useful. That lesson is easy to overlook.
For many businesses, solar installation offers measurable savings, stronger resilience, and a visible commitment to responsible operations. The right decision depends on verified numbers. Compare electricity usage, installation costs, financing terms, incentives, and expected output with an experienced professional. When the design matches the building, solar becomes more than a green statement. It becomes a carefully managed business investment.

Commercial Solar Growth: 345 GW of Capacity Added Globally in 2023
Why Choose Solar Installation for Your Business?
Commercial Solar Growth: 345 GW of Capacity Added Globally in 2023
Global solar capacity increased by 345 GW in 2023, showing how quickly businesses are adopting onsite energy. This growth is not only about environmental goals. It reflects a practical response to rising electricity costs, unstable energy markets, and growing demand for cleaner operations.
A warehouse with a broad roof can turn unused space into a working asset. Panels can produce power during daytime shifts, when lighting, cooling, machinery, and computers consume the most electricity. A qualified installer should review twelve months of utility bills, roof condition, shading, and local grid requirements before designing the system. Meter data matters.
The scale matters.
Commercial solar can reduce exposure to changing energy prices, but savings are never automatic. Roof repairs, equipment replacement, maintenance access, and connection fees can affect the financial result. Storage may improve resilience, though batteries require additional space, controls, and careful safety planning. Businesses should also check current permits, incentives, and tax rules with qualified local professionals.
Solar output changes with weather and seasons. Clouds still matter. Forecasts can be imperfect, and a system sized for today’s operations may not fit tomorrow’s expansion. A reliable plan includes performance monitoring, documented warranties, and a realistic review of electricity use. The strongest projects connect engineering evidence with daily business needs, rather than treating solar as a symbolic upgrade.
Why Choose Solar Installation for Your Business?
Global solar power capacity added annually, 2020–2023 (GW)
Global solar capacity additions rose sharply to approximately 346 GW in 2023. For businesses, installing solar can help reduce exposure to grid electricity costs and support lower-carbon operations. Capacity figures are rounded; source: IRENA, Renewable Capacity Statistics 2024.
How Photovoltaic Systems Work: Commercial Modules Exceed 20% Efficiency
How Photovoltaic Systems Work: Commercial Modules Exceed 20% Efficiency
A photovoltaic module converts sunlight into direct-current electricity. Within each silicon cell, incoming light releases electrons, creating an electrical current. Inverters then convert that current into alternating electricity used by equipment, lighting, and ventilation. The process is quiet. On a sunny roof, the modules produce power without moving parts, though clouds, heat, and shading affect output.
Commercial modules now commonly exceed 20% conversion efficiency. Fraunhofer ISE’s Photovoltaics Report documents this shift, with leading commercially available crystalline-silicon modules reaching roughly 22–24% efficiency. That figure describes the share of sunlight converted under standard test conditions, not a business’s annual energy savings. Real output depends on roof orientation, local weather, temperature, and system design. Even a narrow shadow from a vent can reduce production across connected cells, so site assessment matters.
For a business, higher-efficiency modules can generate more power from limited roof space. That can be useful when a warehouse roof is crowded with skylights or mechanical units. But efficiency is not the whole decision. Installation costs, inverter losses, maintenance access, and electricity-use patterns also shape project value. I’d want those assumptions checked against actual utility bills. Estimates can look tidy; rooftops rarely are.
Business Economics: Solar PV Costs Fell 90% Between 2010 and 2023
Why Choose Solar Installation for Your Business?
The economics have shifted sharply. IRENA’s Renewable Power Generation Costs in 2023 reports that the global weighted-average levelized cost of electricity from newly commissioned utility-scale solar PV fell 90% between 2010 and 2023, from about $0.46 to $0.044 per kilowatt-hour. That is a generation-cost measure, not a promise that every business’s installation price dropped by 90%. Still, it shows how dramatically the technology’s economics have changed.
For a business, the value depends on site conditions and electricity use. A warehouse with broad, unshaded roofs and steady daytime demand may use more of its own solar power. That can reduce purchases from the grid, while a battery may help shift some supply into later hours. The numbers need checking. The U.S. Department of Energy’s National Renewable Energy Laboratory publishes commercial PV cost benchmarks because equipment, labor, permitting, and project design all affect installed cost. A roof inspection and interval-meter data can reveal constraints that a headline price misses.
Solar also asks for capital upfront, and savings vary with local tariffs, financing, maintenance, and how long the business occupies the site. IRENA’s global figures do not predict a particular project’s payback. Even so, falling generation costs make a site-specific assessment more worthwhile. A few cloudy days can make the system look less impressive. The annual profile matters more.
Why Choose Solar Installation for Your Business? — Business Economics: Solar PV Costs Fell 90% Between 2010 and 2023
Sources: International Renewable Energy Agency (IRENA), Renewable Power Generation Costs in 2023 (global weighted-average utility-scale solar PV LCOE); IRENA, Renewable Capacity Statistics 2024 (2023 solar PV capacity additions). LCOE is a global benchmark and is not a commercial rooftop installation quote.
IRENA cost report ·
IRENA capacity statistics
Energy Resilience: Battery Storage Reaches 98 GW Globally by 2023
Why Choose Solar Installation for Your Business?
Energy Resilience: Battery Storage Reaches 98 GW Globally by 2023
Global battery storage capacity reached about 98 GW by 2023, reflecting fast growth in energy storage. For businesses, batteries can store excess solar power for later use. A system may keep essential lights, refrigeration, or network equipment running during a grid interruption. That can reduce disruption, but it does not guarantee uninterrupted power. Results depend on battery size, equipment needs, and outage duration.
Solar and storage can also help businesses manage electricity use during peak-demand periods. Picture a sunny afternoon: panels supply the building, while surplus power charges the battery. After sunset, stored energy can support selected loads. The 98 GW figure describes global capacity, not the amount available to any one business. Site conditions matter. So do costs. A careful assessment should review past bills, local sunlight, critical equipment, and expected backup hours. Estimates can miss the mark.
Tips: List the equipment your business cannot afford to lose, then estimate its running time. Ask for a load analysis and a clear battery-capacity estimate. Check how the system performs on cloudy days, too. Storage adds resilience, but it also adds cost and maintenance needs. That trade-off deserves a closer look.
Emissions Reduction: Solar PV Produces About 41 g CO₂e per kWh
Why Choose Solar Installation for Your Business?
Emissions Reduction: Solar PV Produces About 41 g CO₂e per kWh
For a business using rooftop solar, each kilowatt-hour generated can reduce reliance on grid electricity. A commonly cited lifecycle estimate is about 41 grams of CO₂-equivalent per kilowatt-hour for solar photovoltaics. This figure includes emissions from manufacturing, installation, operation, and disposal—not just the panels’ time on the roof. That matters. It offers a more complete comparison than counting operational emissions alone.
Actual results vary. Panel production methods, system lifespan, sunlight, and local grid emissions all affect the outcome. A shaded warehouse roof, for example, will usually produce less electricity than a clear, south-facing roof in a sunny region. Businesses can review expected annual generation and the assumptions behind any emissions estimate before making a decision. The 41-gram figure is useful, but it is not a promise for every site. Even careful projections can miss changes in energy use or maintenance needs. That uncertainty deserves attention. A site assessment and transparent performance estimates can help connect the headline number to the electricity a business can realistically generate.